Introduction
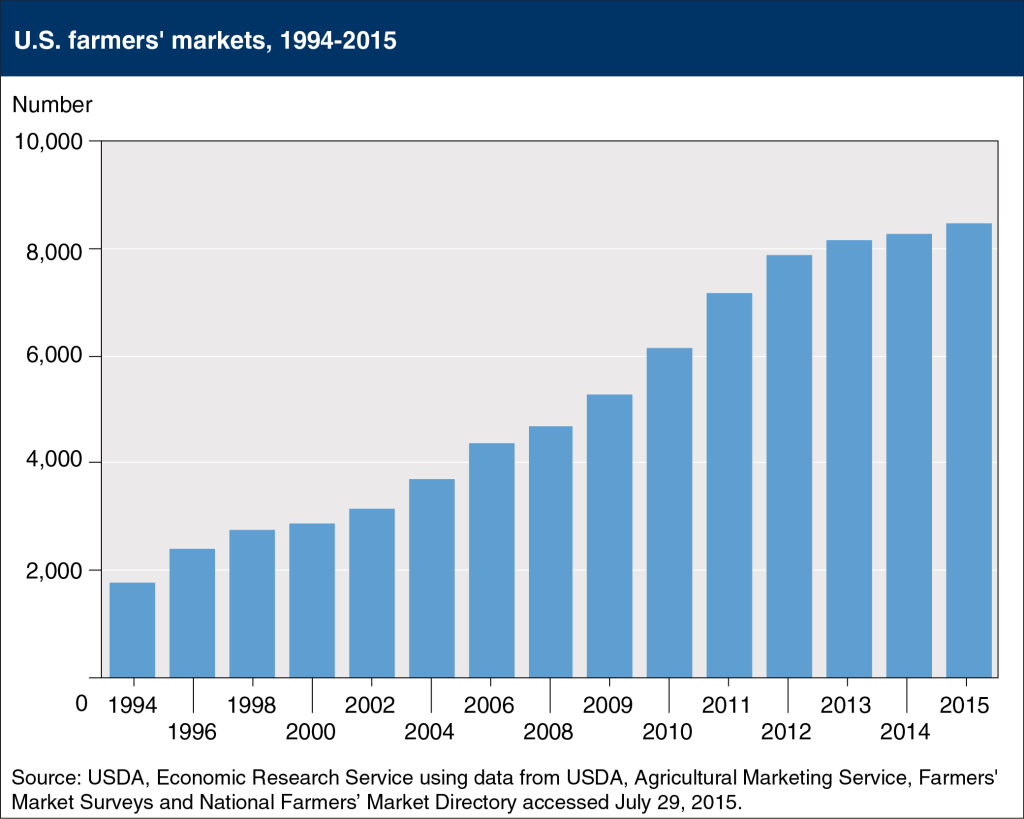
Farmers markets have been around for about thousands of years, and probably were one of the first points of business where people brought food for daily consumption. Some studies indicate that farmers’ markets existed in Egypt 5000 years ago. In the U.S. modern farmers’ markets first appeared in the 1600s and were the primary means for people to buy food. The popularity of the farmers’ markets held steady from then to the 1900s, and apart from being points of business also became hubs of social interaction. After World War II, with better transportation and more stores the popularity of farmers markets waned from the 1950s to 1970s. In the 1970s there was a resurgence of interest in farmers markets. The USDA officially began to keep data on farmers markets from 1994. In 1994 there were about 1755 markets and by 2014 there were more than 8000 markets countrywide.
What is a farmers’ market?
USDA defines a farmers’ market as “A farmers’ market is a common area where several farmers gather on a recurring basis to sell a variety of fresh fruits, vegetables, and other farm products directly to consumers.” In addition to the earlier mentioned products farmers’ markets can also sell prepared, canned, baked processed food, flowers, plants, crafts and products as deemed appropriate by the organizers.
Why this project?
I grew up in Tanzania, India and the UAE, where I was exposed to the concept of farmers selling directory to consumers. It was an accepted feature of daily life and not much thought was put into it. After I moved to the US in mid-2000s the way I saw, bought and consumed food changed dramatically. As much as I was used to food stores in other countries the concept of a food store in the U.S. is moderately to extremely different. I was in awe of the range of products offered in an average store and at the same time struck by fact that I had no connect to the food that I was buying or eating. In 2006 a friend in the DC area introduced me to a farmers’ market and I was kind of mesmerized by it. To me the U.S. farmers’ markets were a reminiscence of the markets that I was used to but realized that they were much different. The U.S. farmers’ markets are centers of business, hubs of social interactions, and support food programs which are not that common in other countries. Thus began a journey into understanding, learning and buying from U.S. farmers. In 2007 I wrote a article for SPAN, a cultural magazine published by the U.S. Embassy in India. Since then 2007 I have been photographing farmers’ markets whenever I travel in the U.S.
For the DCIP capstone project I decided to do a data analysis and visualizations of the farmers’ market data to provide an extra layer and better understanding to the project I have been doing for the past 14 years.
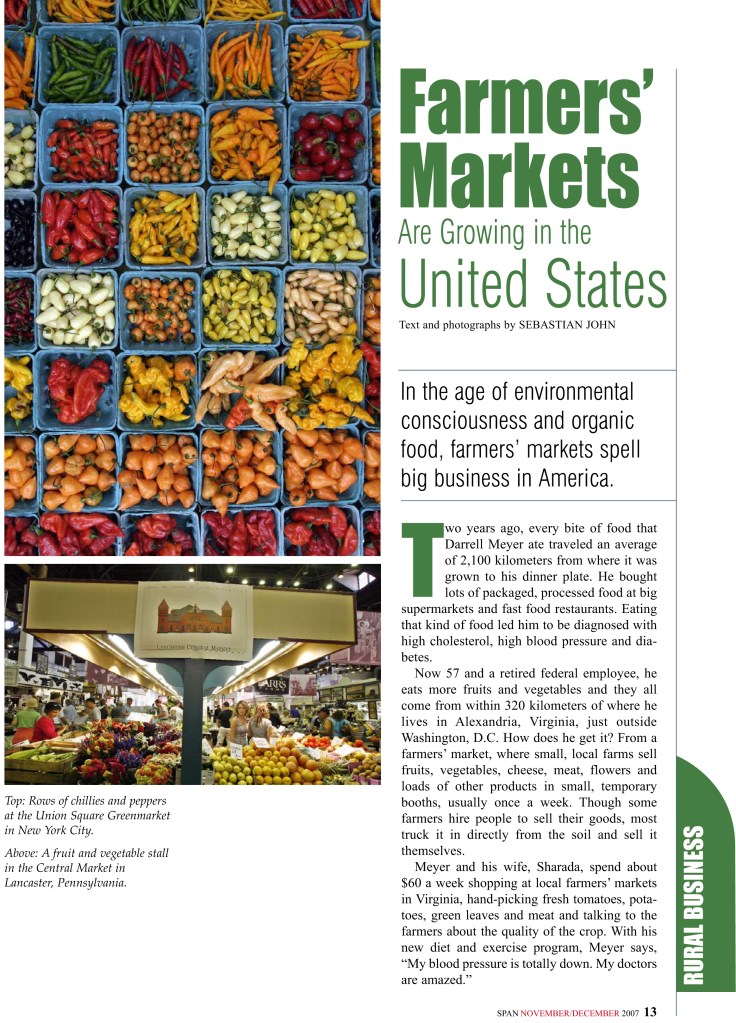
SPAN Article – Farmers’ Markets are growing in the United States
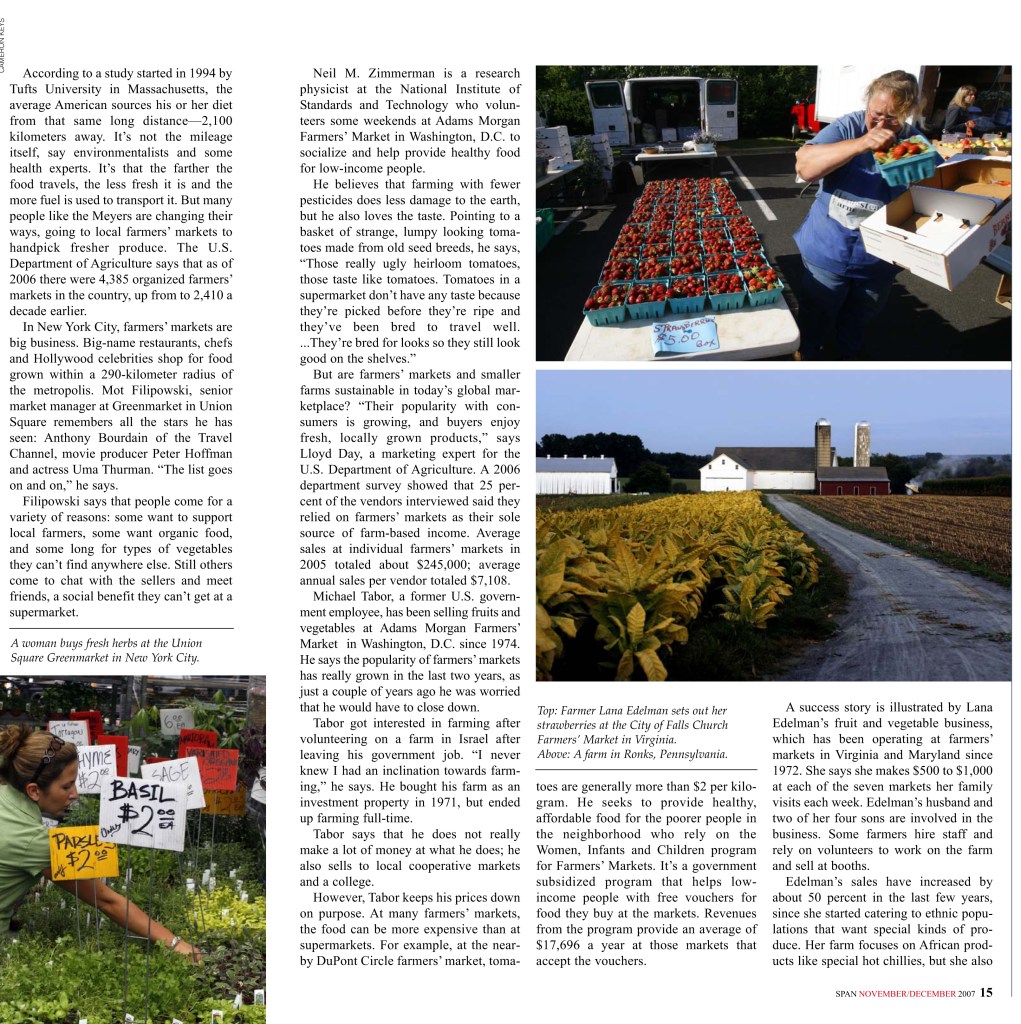
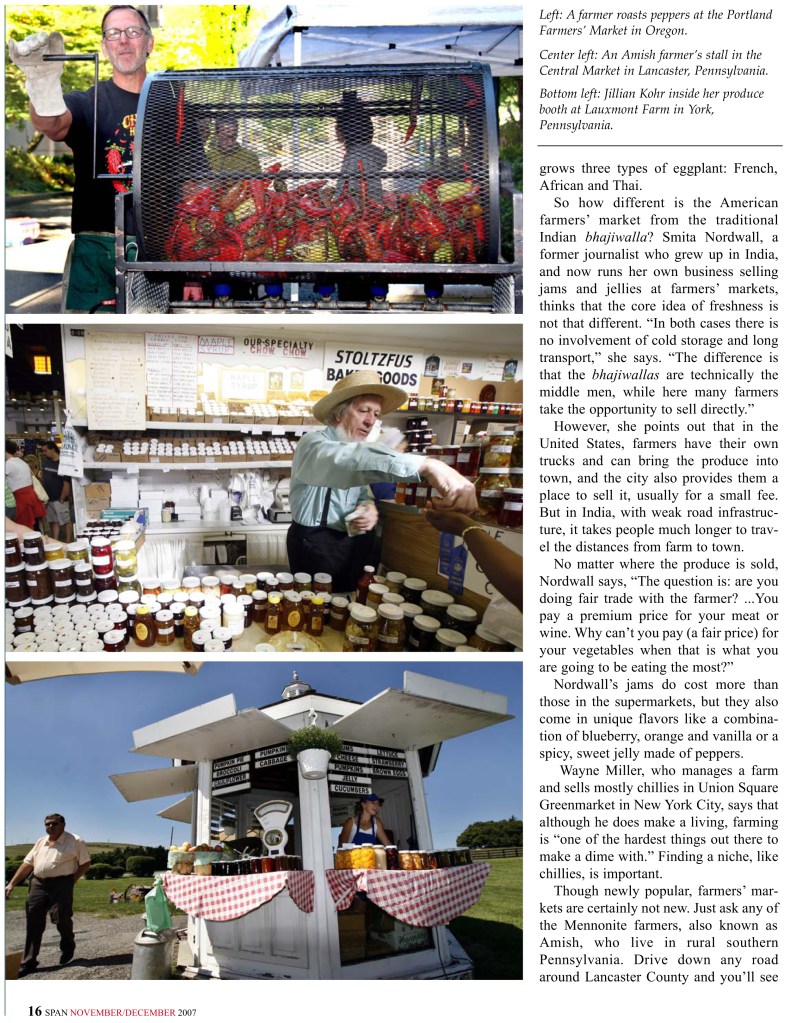
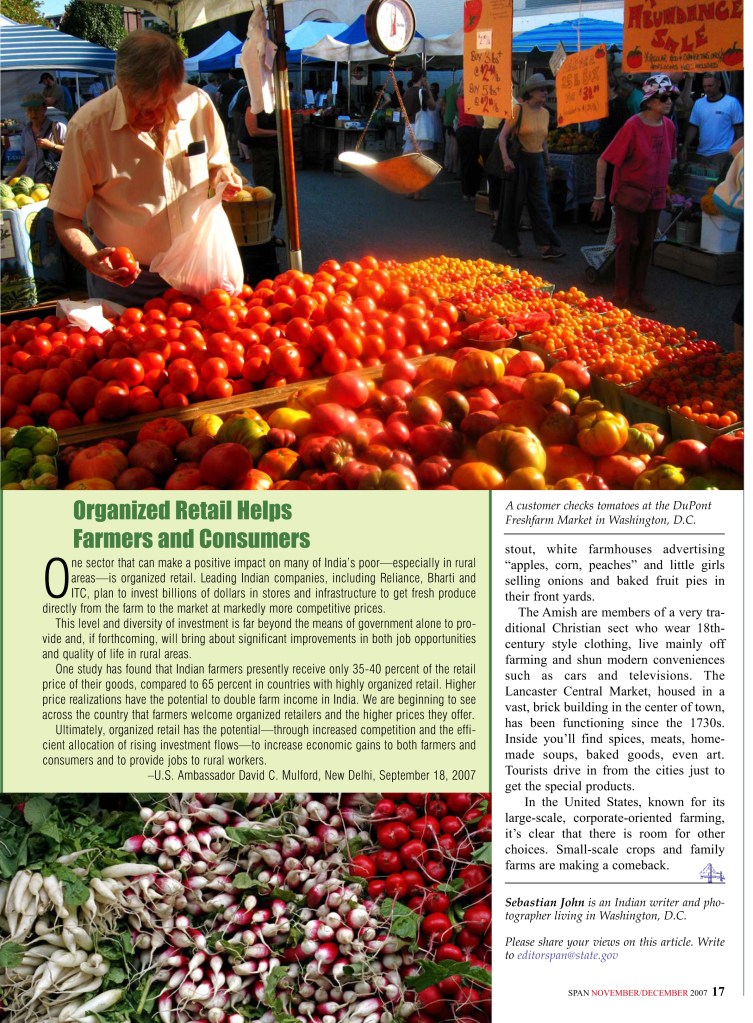
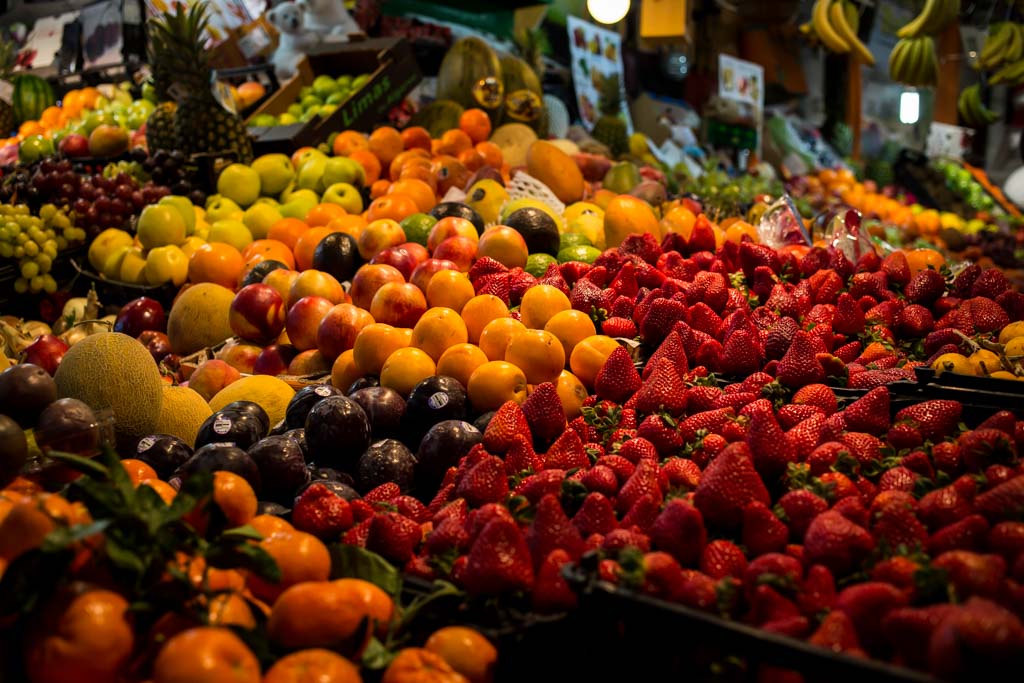
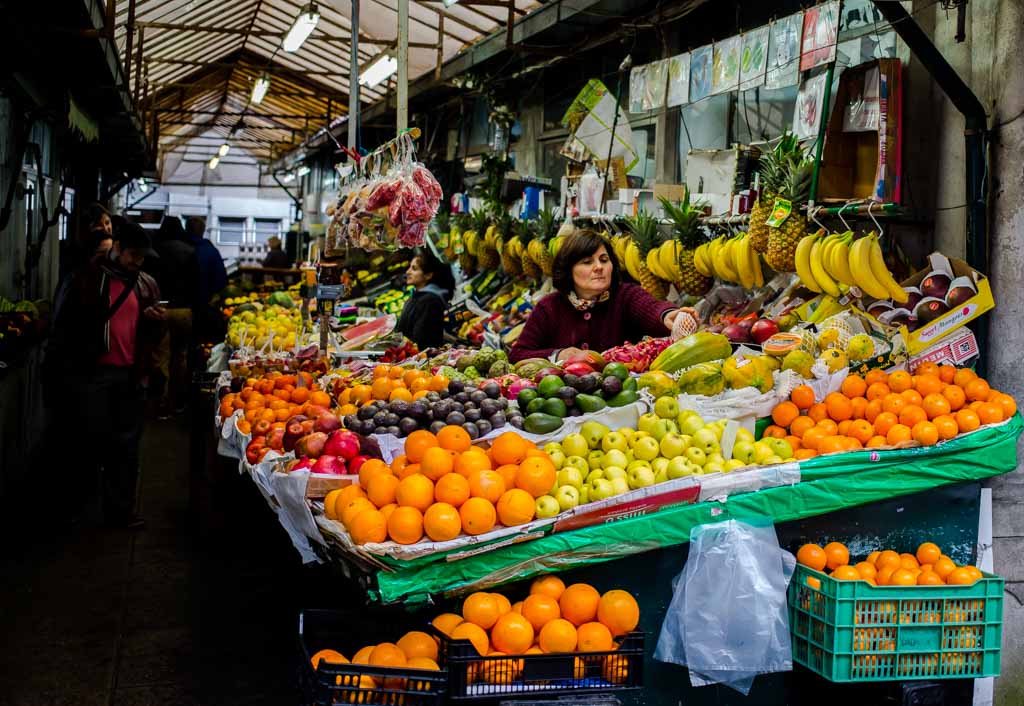
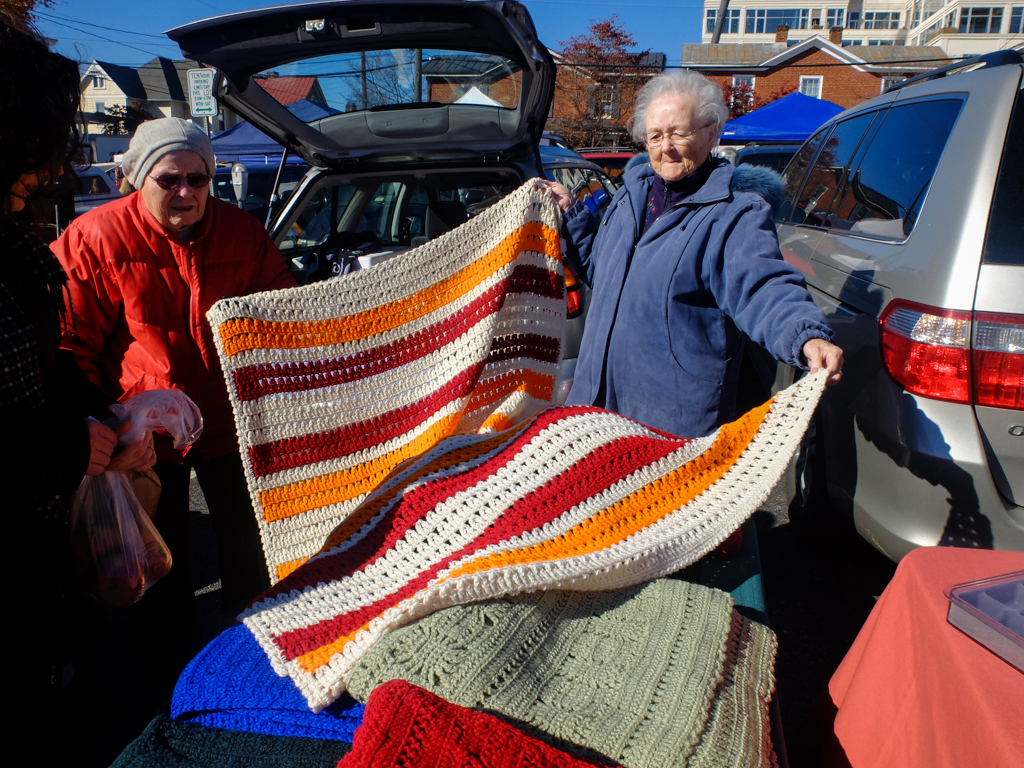
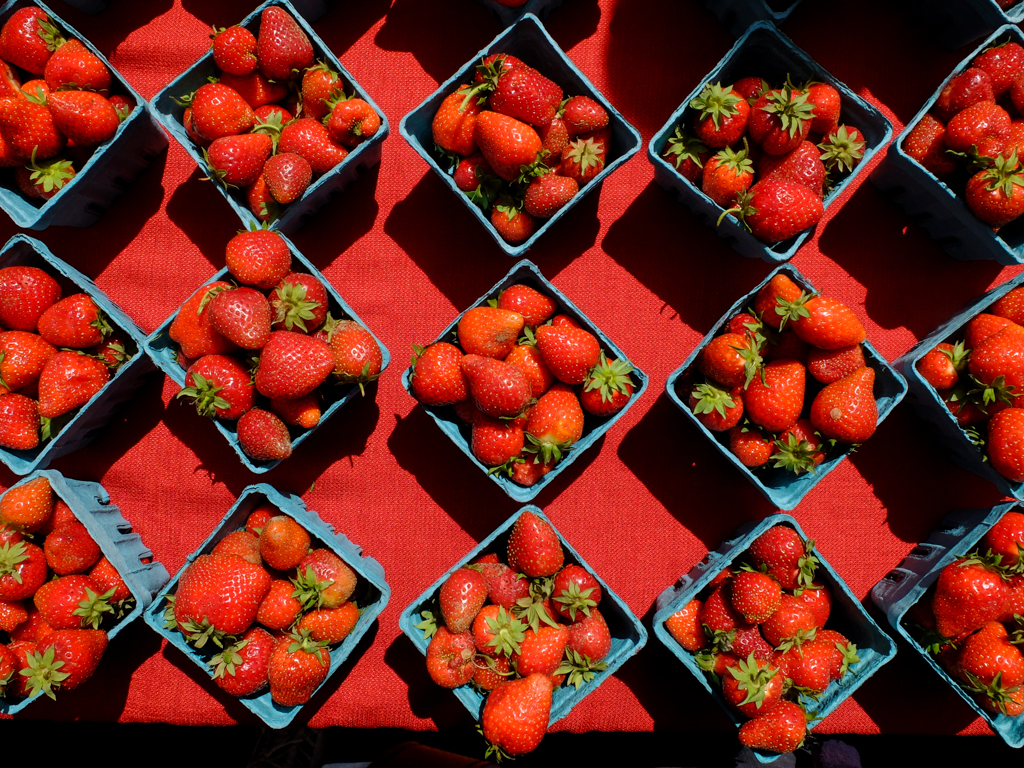
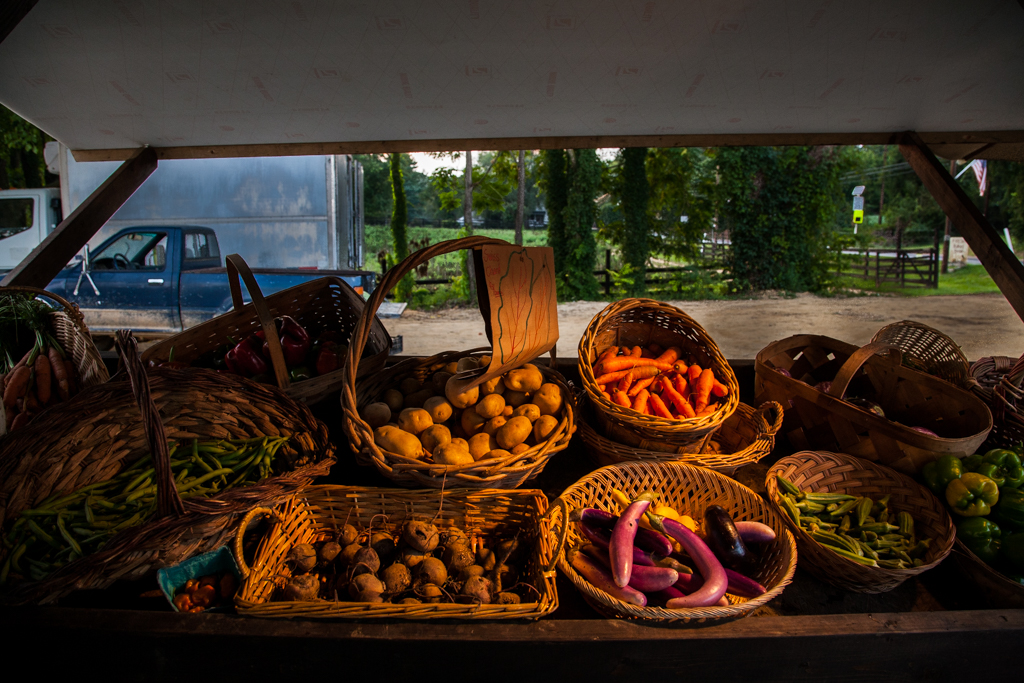
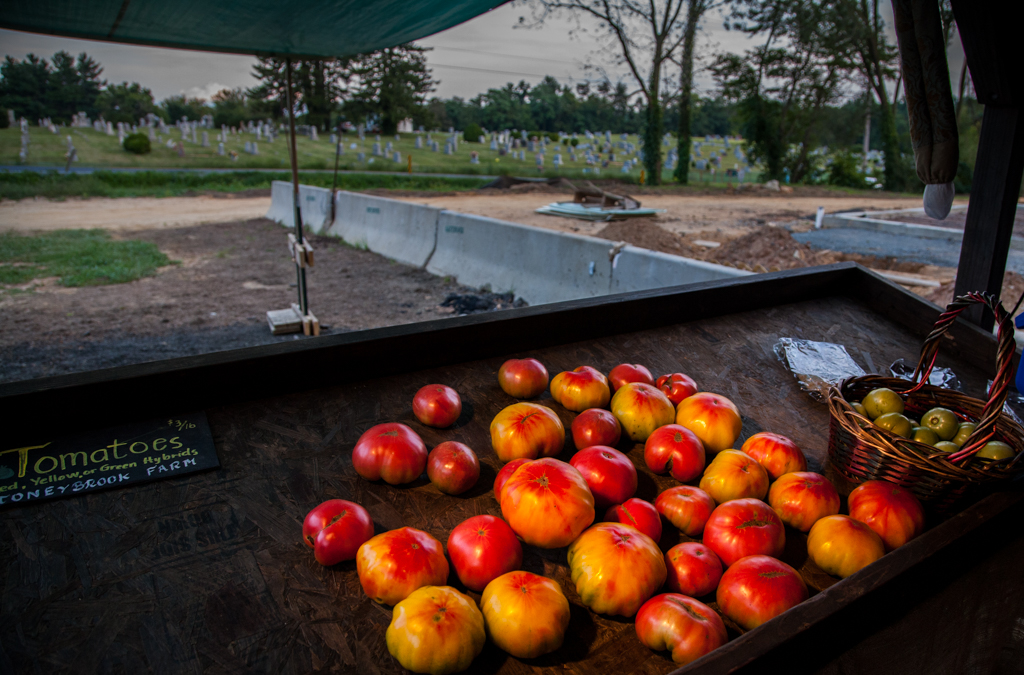
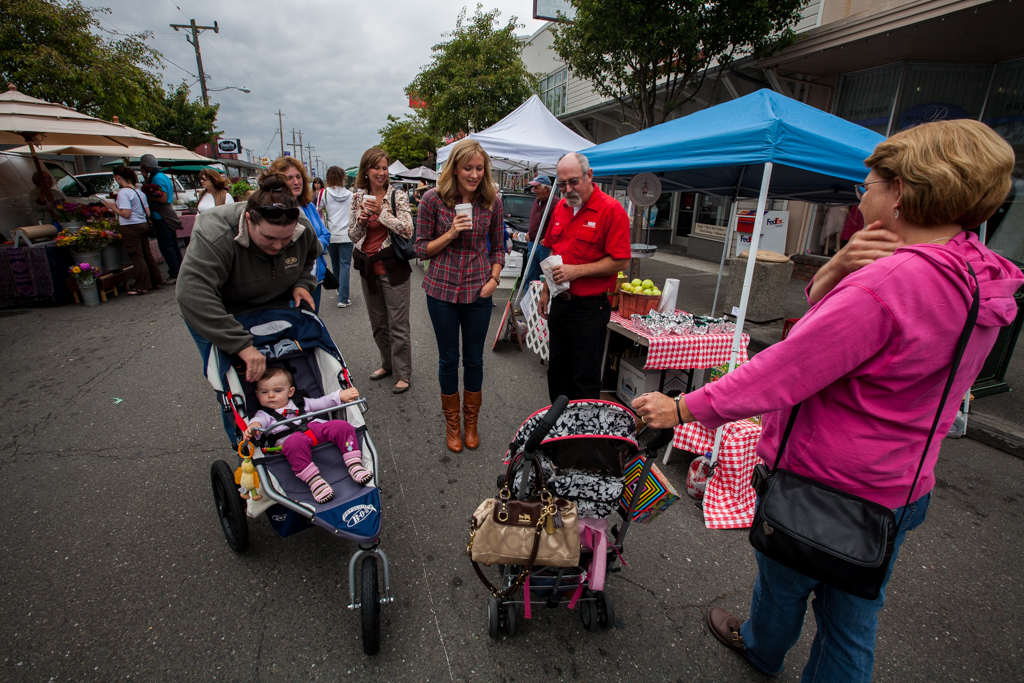
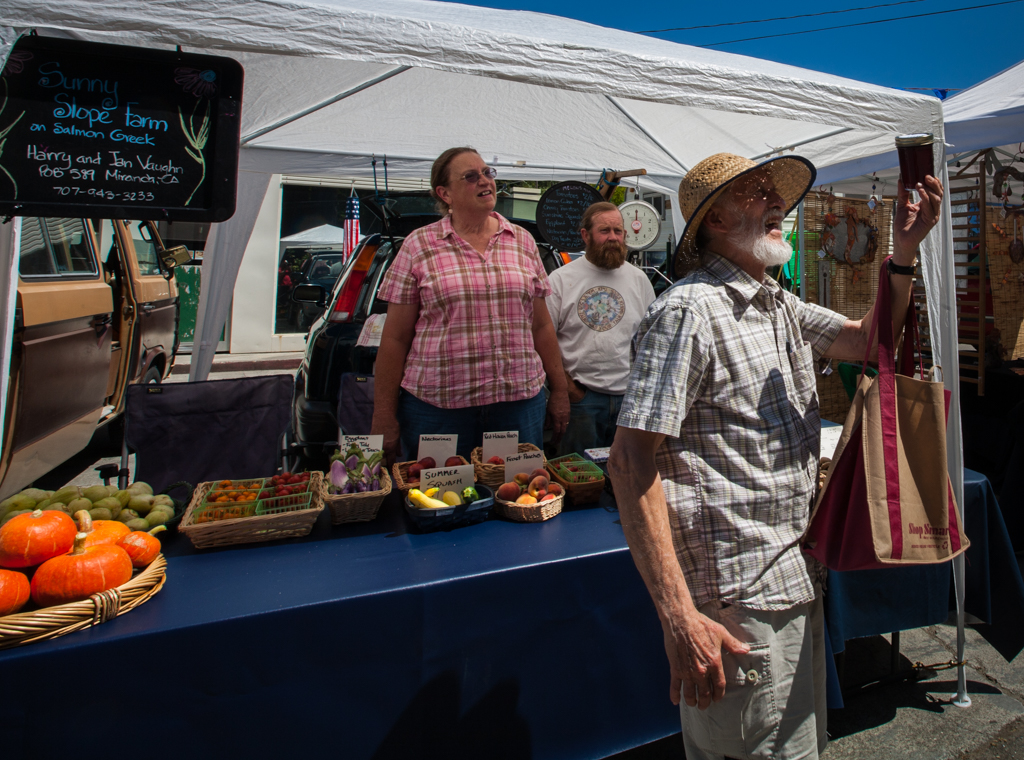
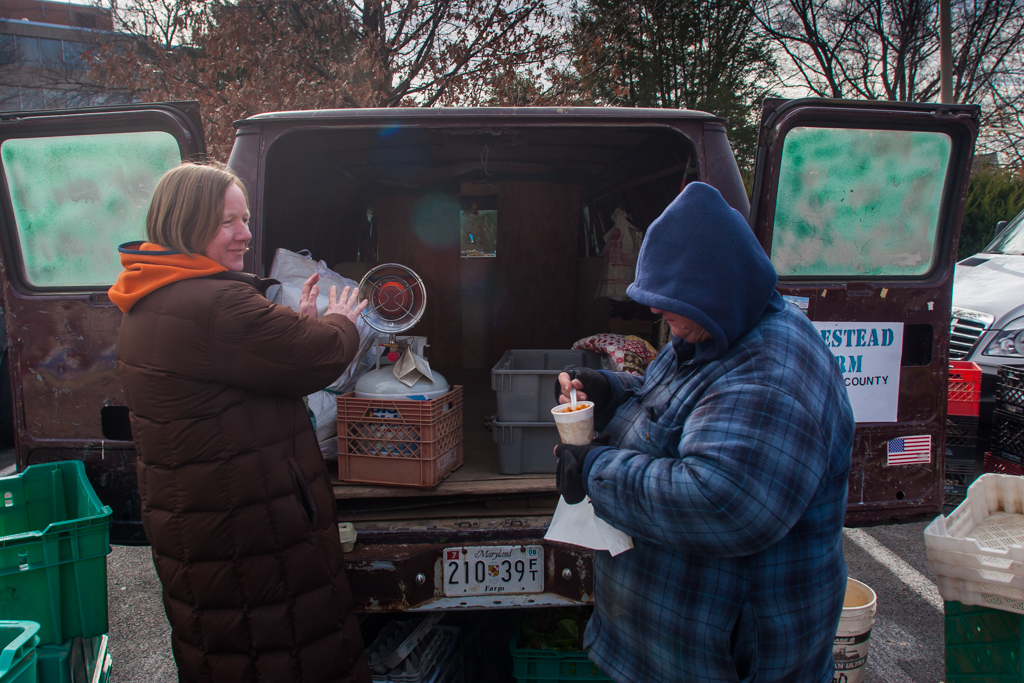
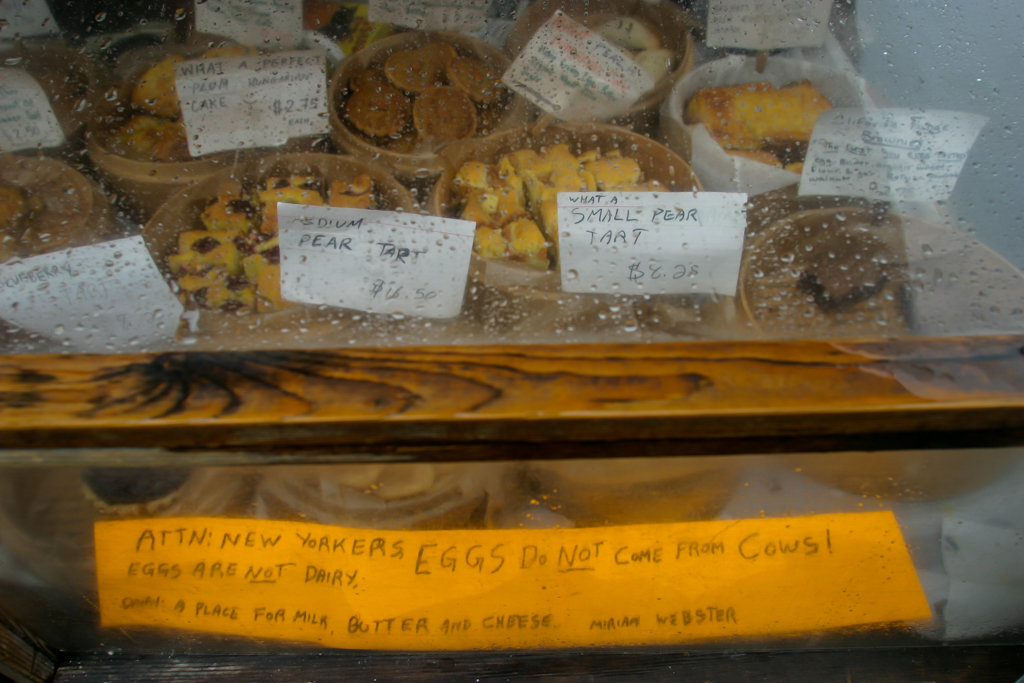
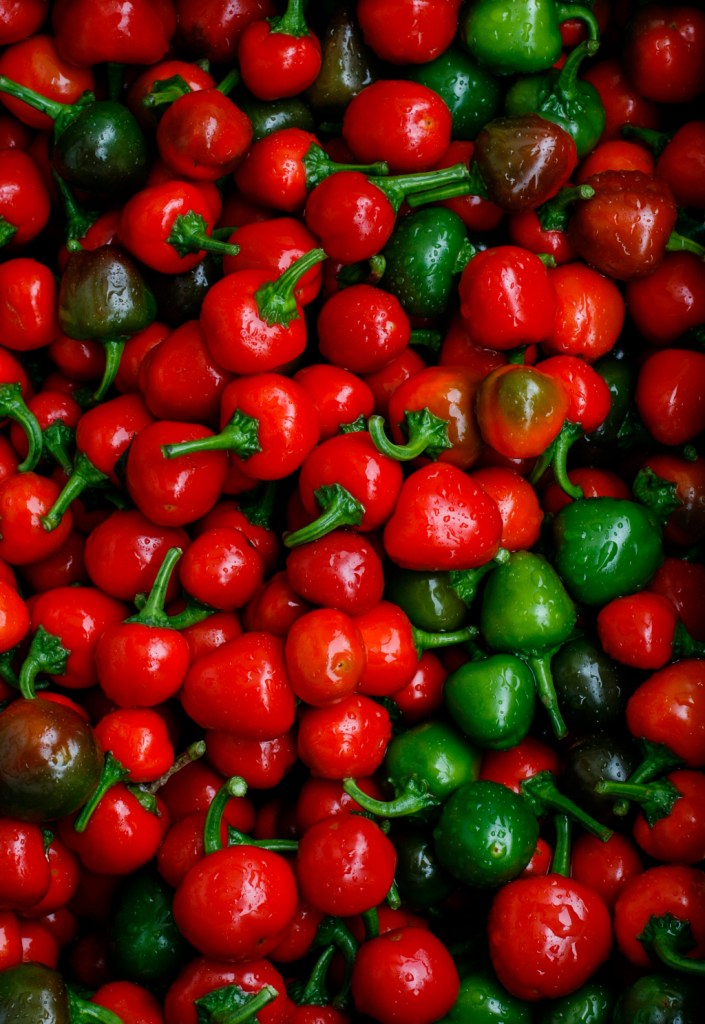
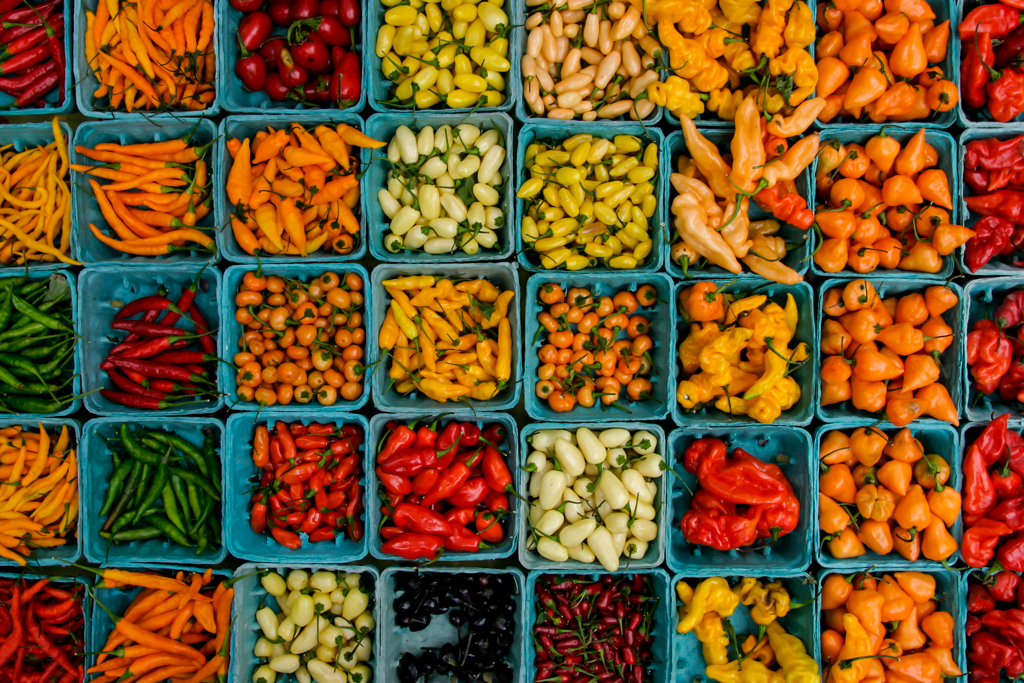
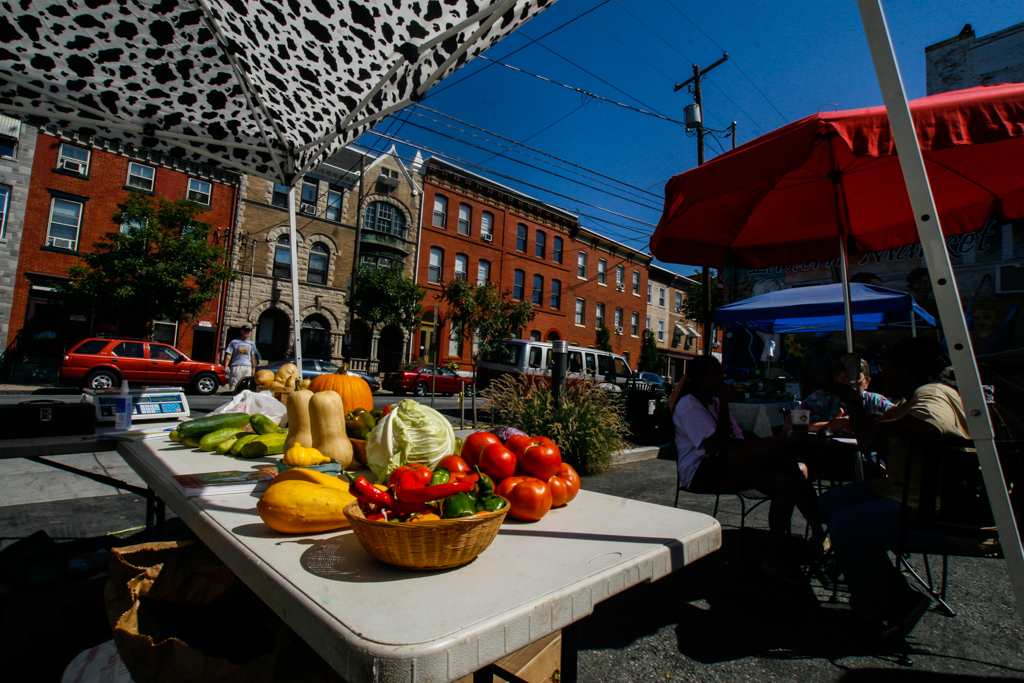
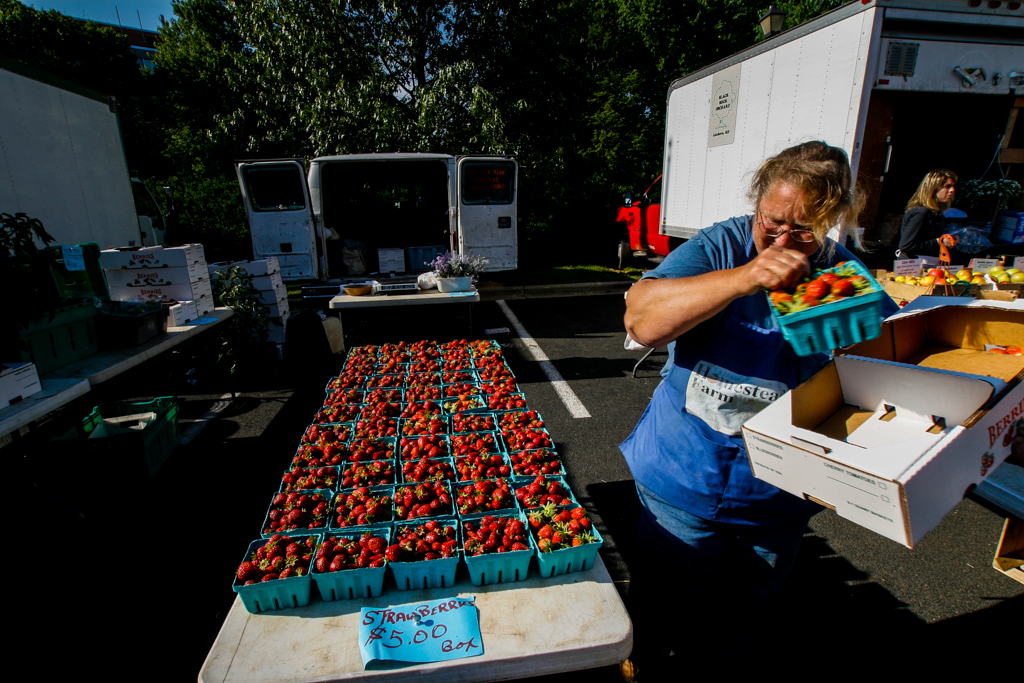
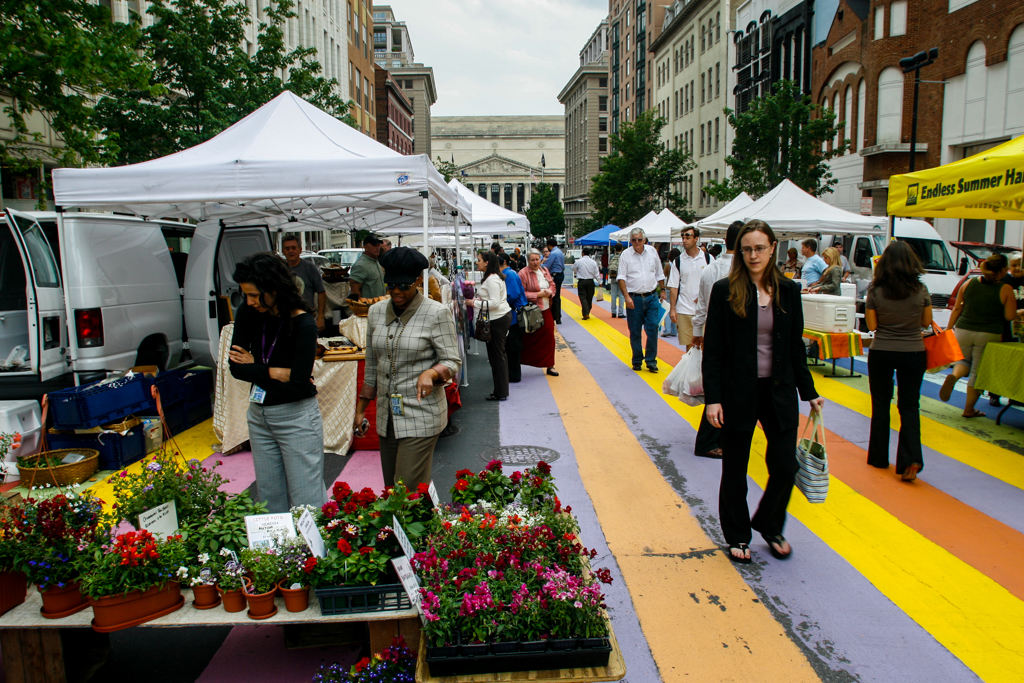
Photographs of various farmers markets across the U.S.


Datasets
The United States Department of Agriculture has been compiling datasets on farmers markets since 1994.
For the project I wanted to study –
- The growth of farmers’ markets from 1994 to Current. Unfortunately I was not able to get the datasets for the said year span. But I was able to get two datasets. The first dataset, published by USDA in 2019/2020, was obtained from an archived site. The dataset had more than 8000 listed markets (Dataset), with market names, state, county, zip code, seasons and products. The second dataset is a current directory on the USDA website, and was downloaded as an Excel file. The current directory lists only about 1600 websites, and for unknown reasons markets in certain states are not listed. The sudden drop from 8000-plus markets in 2019 to 1600 markets is bit perplexing and I am not sure if the current directory is influenced by the ongoing COVID-19 pandemic. Hence for the study I chose to use the 2019/2020 archived data because I felt it was more consistent with market data since 2012.
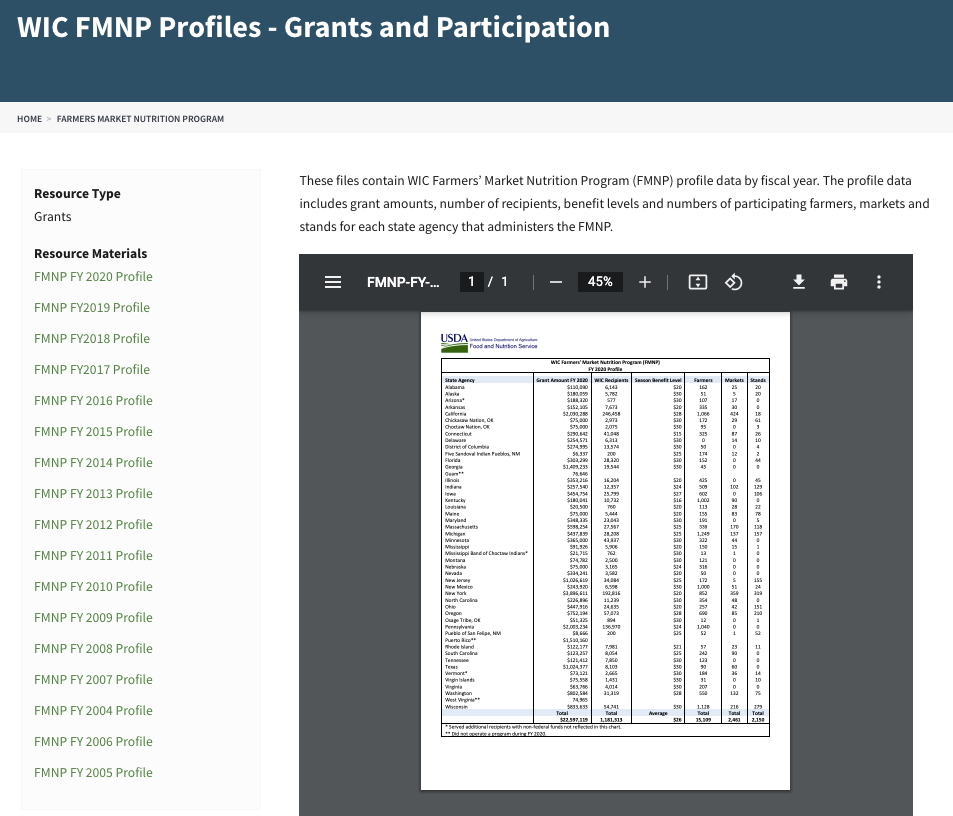
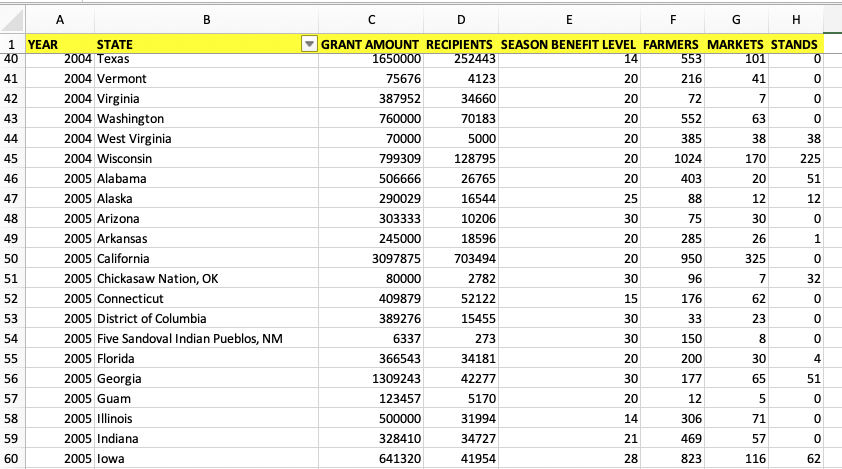
2. WIC Farmers’ Market Nutrition Program (FMNP) associated with the Special Supplemental Nutrition Program for Women, Infants and Children (Datasets – from 2004 to 2020)
3. Seniors Farmers’ Market Nutrition Program (Datasets – from 2004 to 2020)
Transforming and Cleaning Data
USDA datasets were obtained as Excel, CSV and PDF files.
I used OpenRefine and Excel to transform and clean the 2019/2020 U.S. farmers’ market dataset. There was some erroneous and missing data for fields like zip code, county and state. I used the provided addresses of the markets and open source research to rectify those errors and make the data consistent. Overall about 20% of the dataset had erroneous or missing data.
The 2004 to 2020 datasets for WIC FMNP and SFMNP are available on the USDA website in downloadable PDF formats. Using Adobe Acrobat PDF to Excel convertor, I converted the PDF files into excel sheets for each year. All the PDF, barring one, were unlocked files and hence the conversion was generally clean. PDF files from year 2015 for both programs were password protected and the tool was not able to convert the data into Excel files. Hence, for 2015 I had to manually key in the data. I used OpenRefine and Excel to transform and clean the data and then combined the yearly data for each program to generate one spreadsheet for each program.
U.S. Farmers’ Markets
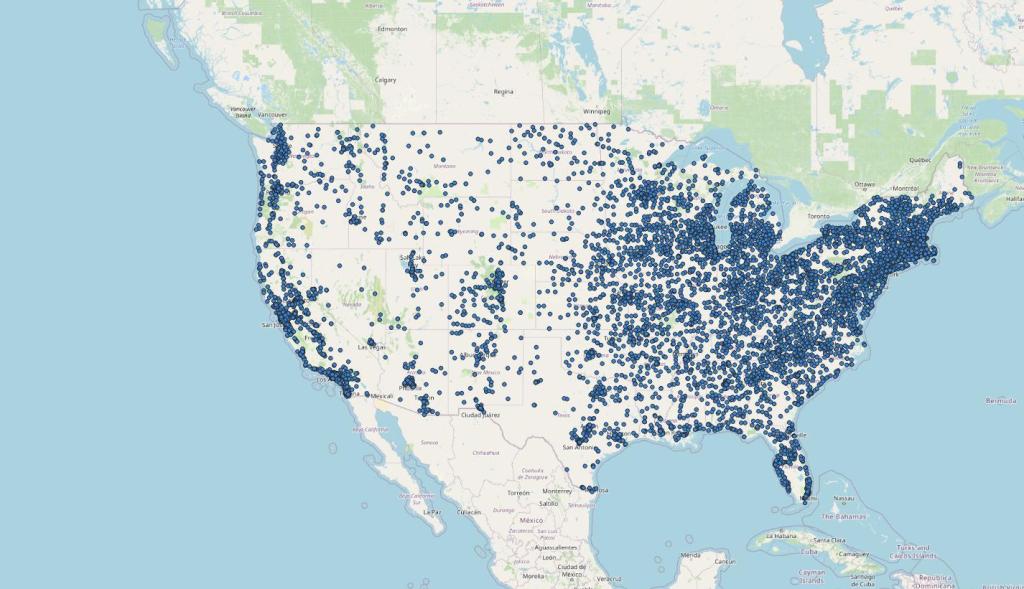
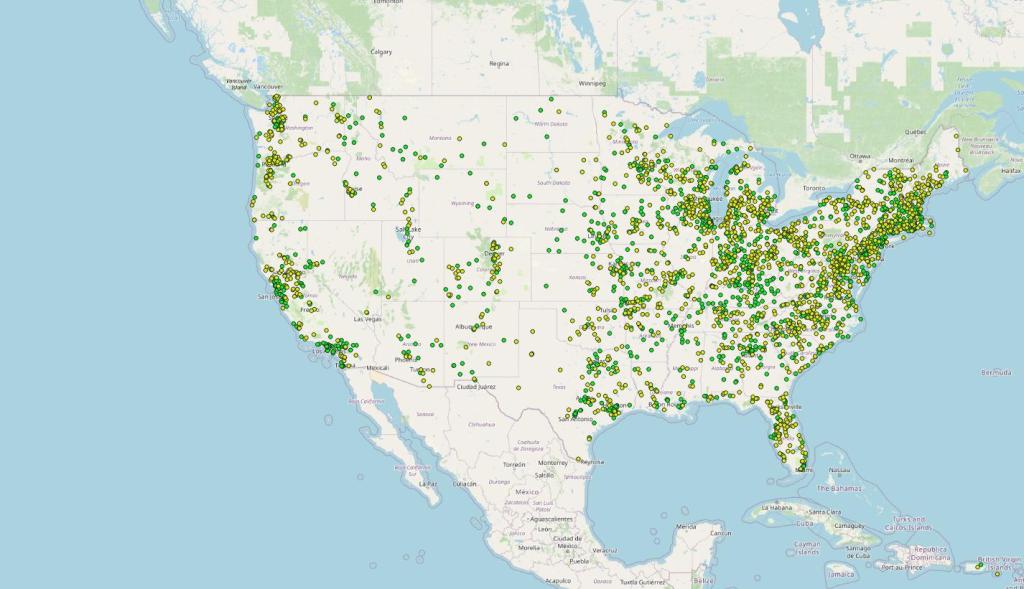
Tableau visualization – U.S. Farmers’ Markets – state, county and zip code T

Tableau visualization – Farmers’ Market – by zip code

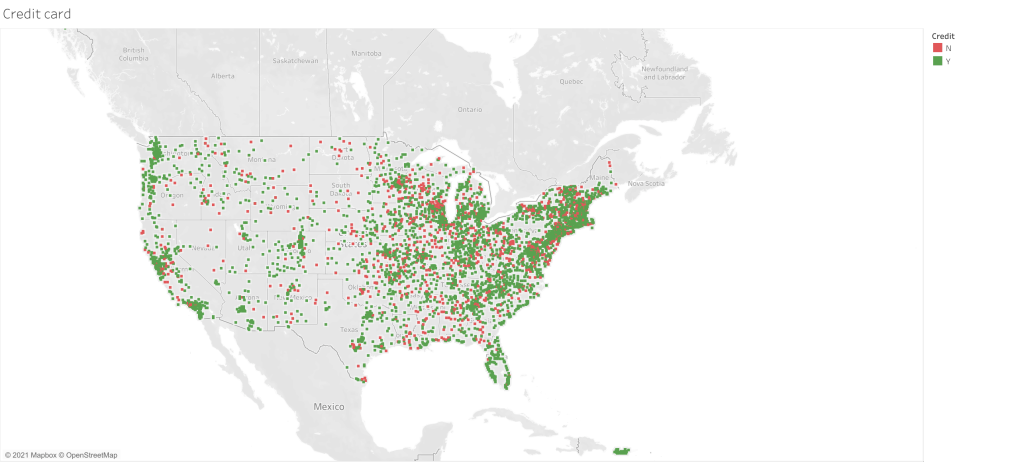
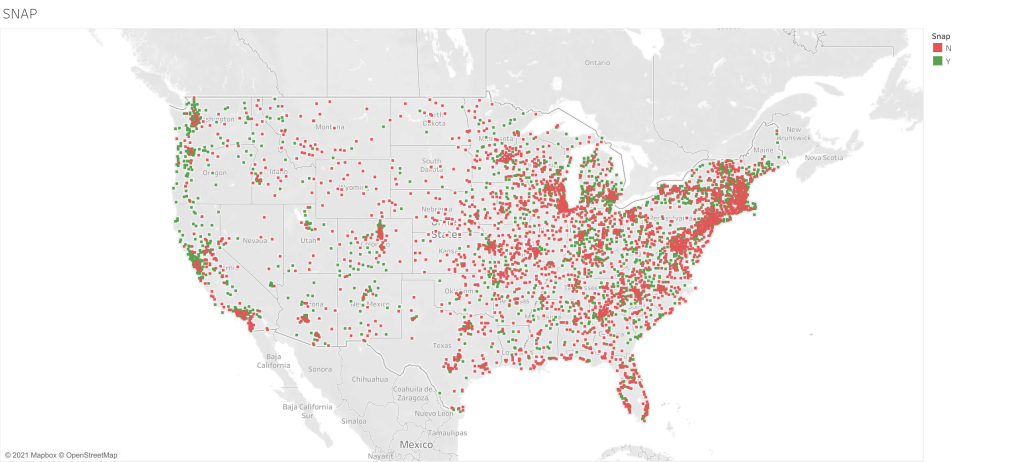
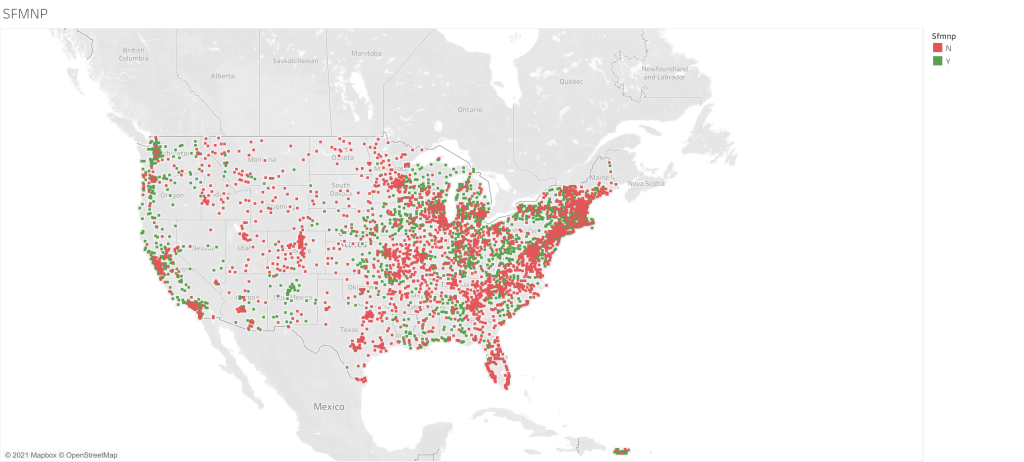
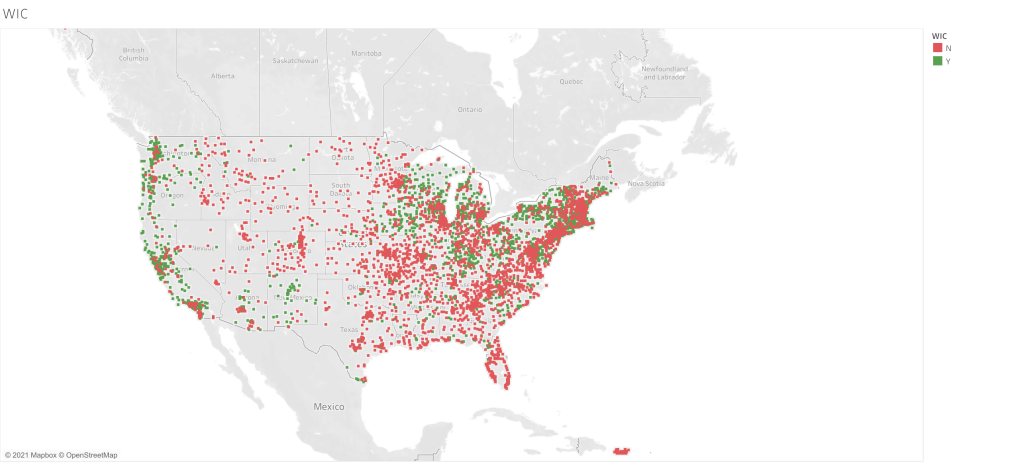
Tableau visualization – Modes of payment – Credit Card, SNAP, SFMNP & WIC

Markets by season
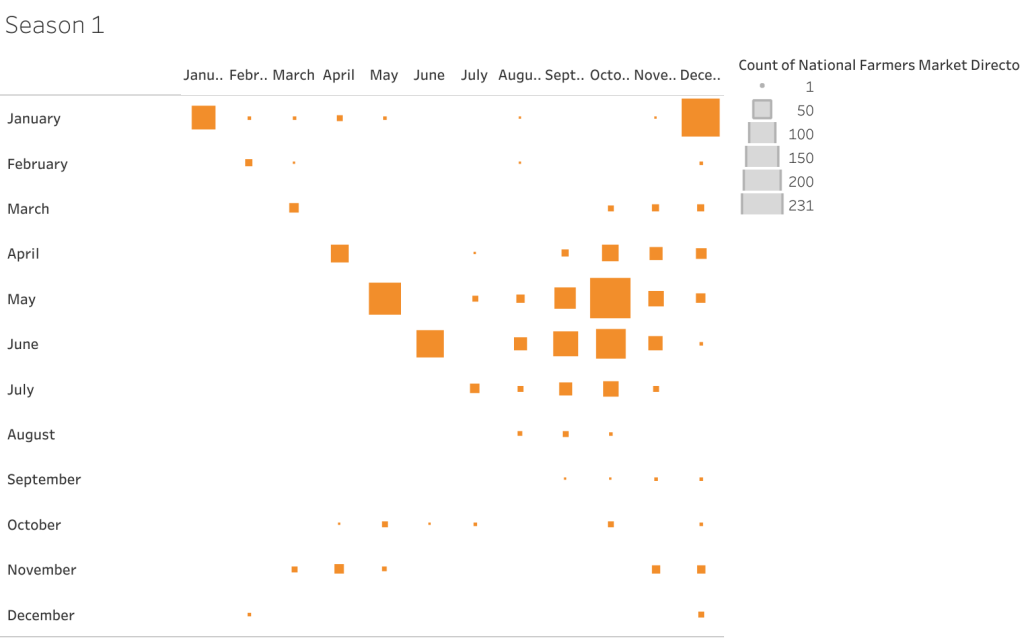
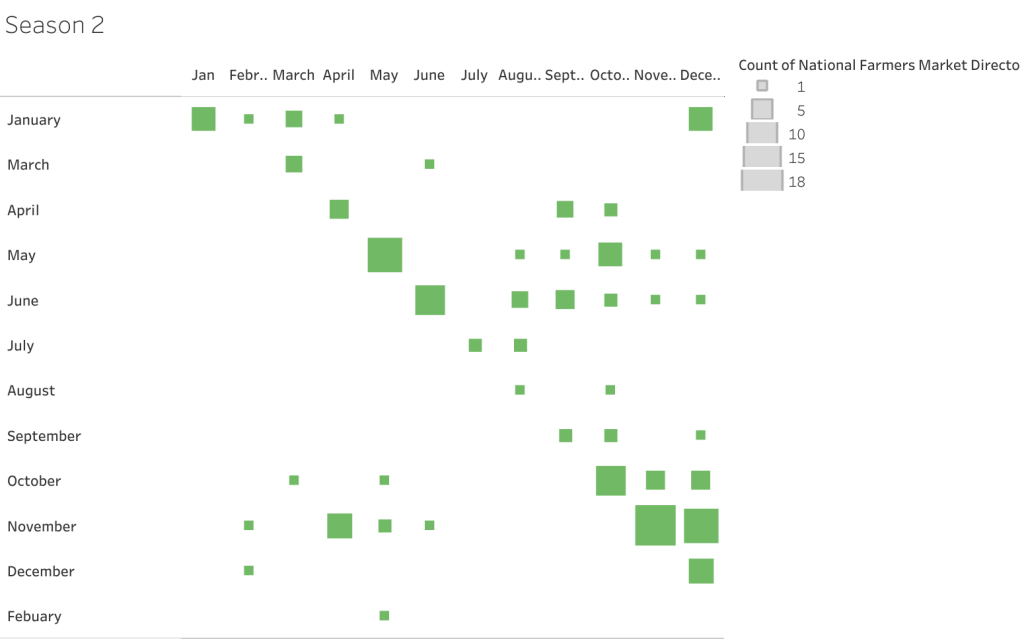

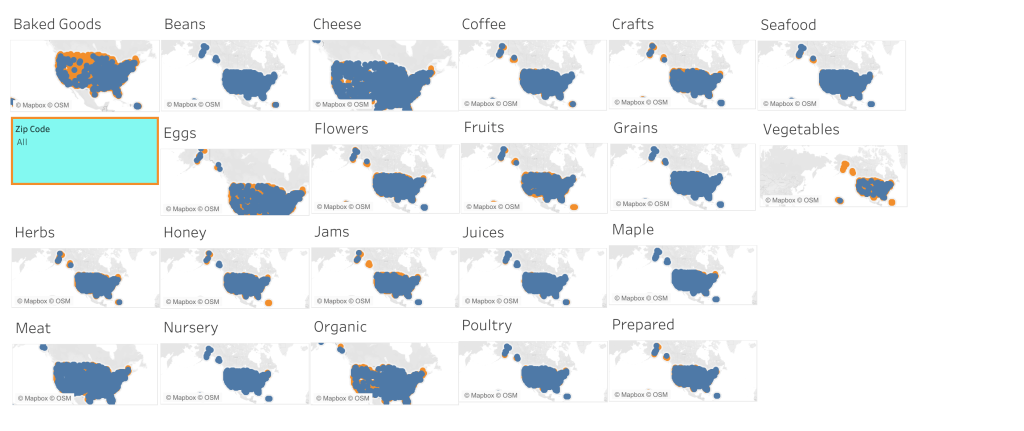
Tableau visualization – Products by Zip Code
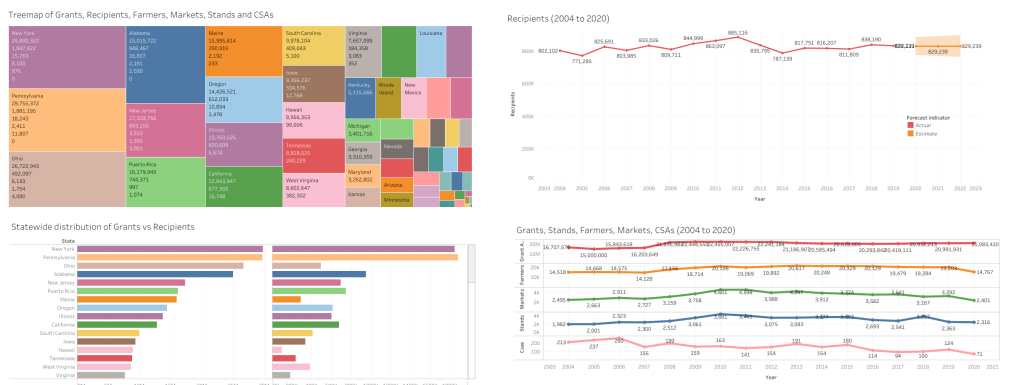
Women, Infants and Children (WIC) Farmers Market Nutrition Program

Seniors Farmers’ Market Nutrition Program

Conclusion
This project was an attempt to study the extent of farmers’ markets across the U.S, product availability in each market, the times of operation and the programs the markets support. Only data published by USDA was used for the project. Data was available in Excel, CSV and PDF formats. After transformation and cleaning of data using Adobe PDF to Excel convertor, Open Refine and Excel, visualizations were done primarily via Tableau and two maps were generated using Q-GIS.
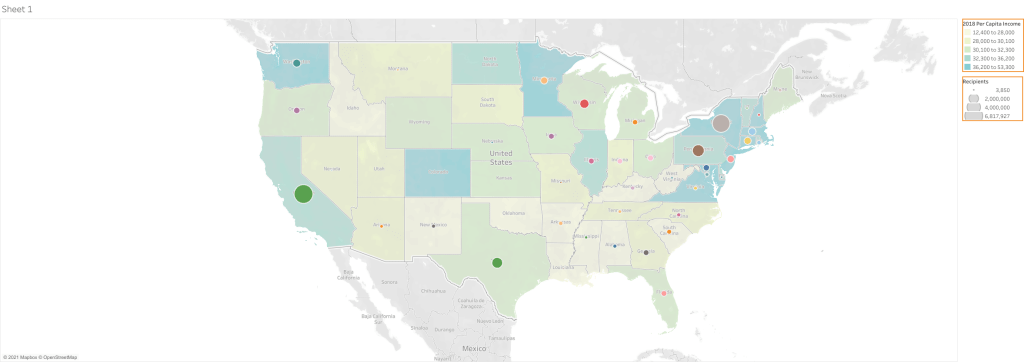
Visualizations indicate that the east and west coast of the U.S. have a heavier concentration of markets. Pennsylvania and California have the largest number of farmer’s markets. Also states with a higher household income tend to have a larger concentration of markets. Based on the data most markets accepted credit cards as form of payment but the percentage of market’s supporting programs SNAP, WIC, SFMNP and WIC Cash was much lower.
Seasonally markets tend to have four seasons of operations, with a very small percentage of markets having a fourth season. 203 markets operated through the year (January to December) and 231 markets operated from May to October.
A plot analysis of products available of zip code showed few surprises – fewer markets sold cheese and coffee than expected. Markets selling organic products were largely concentrated on the west coast and north east. Maple products as expected were concentrated in the north east markets.
Graphs using the USDA data on WIC and SFMNP programs indicate that recipients, farmers and markets supporting the two programs have generally gone down over the years. State of New York outranks all other states for both the programs.
This project is just a small glimpse of the potentially of studying farmer’s market using digital curation and data analysis tools. A better understanding and work knowledge of the used tools can help in generating better visualizations and interpreting information. I intended to use Q-GIS for more visualizations but technical issues led me to abandon the tool. In the future I intend to incorporate Jupyter Notebooks, Neo4j and other data analysis tools.
Additional Reading
A Brief History of Farmers’ Markets
Resetting the Table in the Lehigh Valley – A study of technology, nature, and local food
The rise and decline of farmers markets in greater Cincinnati
Cultural Sustainability through Farmers Markets
COVID-19’s Impact on Farmers Market Sales in the Washington, D.C., Area
Farmers markets are vital during COVID-19, but they need more support
Why Are So Many Farmers Markets Failing? Because The Market Is Saturated
The Cultural Significance of Farmers Markets
